Do not turn a live 12V battery reading directly into an exact percentage. First identify the battery chemistry, then record whether the battery is charging, powering a load, or genuinely at rest. For flooded lead-acid, manufacturer-approved specific-gravity testing may be the most direct method when the cells are serviceable. For AGM, a manufacturer-specific open-circuit-voltage table can provide a bounded estimate after the required rest. For LiFePO4, a correctly installed and synchronized shunt, or a documented battery-management-system estimate, is generally more useful through the flat middle of the voltage curve.
That gives you state of charge (SoC): an estimate of charge remaining relative to the battery’s present full-charge capacity. It does not establish state of health (SoH), original rated capacity, or available runtime under a particular load.
Safety and limitations: A 12V battery can supply destructive fault current, and flooded batteries involve corrosive electrolyte and gas hazards. Use only owner-accessible displays, approved disconnects, and measurement points described by the exact RV, battery, and monitor manuals. Do not open a sealed battery, defeat covers, improvise a disconnect, or move battery conductors to perform a reading. Stop and use qualified service if isolation, access, ventilation, personal protective equipment, or the correct test method is uncertain.
Choose the state-of-charge method
The useful question is not “What percentage is 12.4V?” It is “Which method can support a charge estimate for this battery in this state?”
| Method | Best fit | Required condition | What can make it wrong |
|---|---|---|---|
| Open-circuit voltage (OCV) | Lead-acid when an exact manufacturer table is available | Neither charging nor discharging; rested for the period specified by that source | Active loads or charging, surface effects, temperature, age, wrong chemistry, or a chart for another product |
| Specific gravity | Serviceable flooded lead-acid when the manufacturer permits it | Correct hydrometer method, electrolyte access, temperature handling, and safety procedure from the manual | Sealed AGM/gel construction, unsafe access, technique error, or applying one cell reading to the whole bank |
| Shunt-based monitor | Batteries where all current can be counted through one documented measurement path | Correct placement, capacity and chemistry settings, and synchronization | Bypassed loads/chargers, wrong capacity, missed charge current, drift, or an unsynchronized display |
| BMS estimate | A battery whose manufacturer exposes and documents an SoC value | Supported app/display, documented algorithm and configuration, and normal BMS operation | Product-specific estimation limits, stale data, configuration error, or assuming every BMS derives percentage the same way |
Trojan’s technical FAQ identifies specific gravity as its most accurate state-of-charge method for flooded batteries and limits voltage-based assessment to open-circuit conditions after rest. That advice does not authorize opening an AGM, gel, or lithium enclosure. Lifeline’s AGM technical manual instead provides a product-scoped open-circuit table. Battle Born’s LiFePO4 explanation describes why voltage alone is weak through much of lithium’s relatively flat discharge curve.
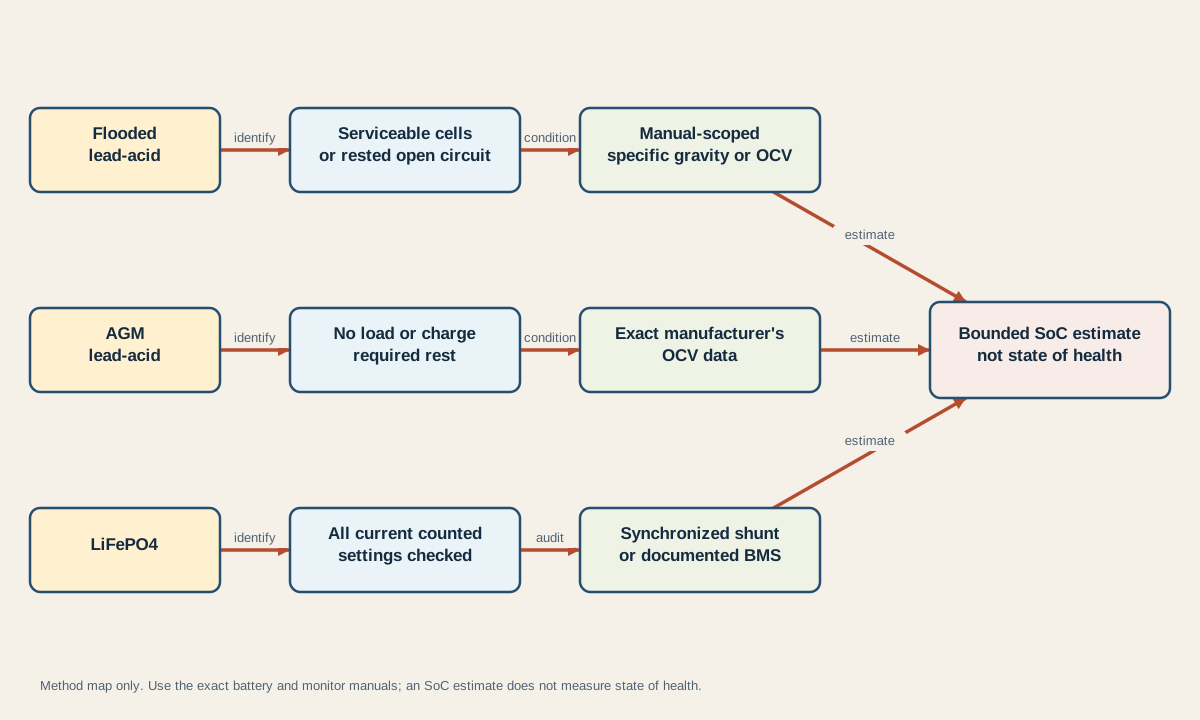
Use the map as a method boundary, not a wiring instruction. “All current counted” is an audit question about an installed monitor; it is not permission to reroute conductors. If the bank contains multiple batteries, first confirm its configuration and exact-model constraints with the series-versus-parallel planning guide.
Before recording any percentage, write down:
- Exact battery manufacturer, model, chemistry, and bank arrangement.
- Where the reading came from: battery terminals at an approved point, RV panel, charger, shunt monitor, or BMS.
- Whether shore power, solar, alternator charging, generator charging, inverter operation, or a meaningful 12V load was active.
- Time since charge and load activity stopped, plus approximate battery temperature.
- The exact manual or table used to interpret the reading.
Without those fields, the number may still describe what a display showed, but it cannot support a precise SoC claim.
Use resting voltage without false precision
Open-circuit voltage means the battery is not receiving or delivering current and has had time to settle. “The lights were off for ten minutes” is not automatically an open-circuit test: background RV loads, solar charging, a converter, an inverter idle draw, controllers, or monitoring equipment may still be active. Use the installed disconnects and procedure specified by the system manuals; do not remove a battery cable just to satisfy a generic chart.
Rest-time requirements are source-specific. Trojan says at least one hour for a stabilized open-circuit reading in its FAQ. Lifeline says its covered AGM battery should normally rest at least four hours to reach steady state. Use the requirement attached to the exact data you are applying, not whichever interval is shorter.
A deliberately scoped AGM example
The following is not a universal 12V battery chart. It reproduces approximate values from the Lifeline technical manual for the Lifeline AGM products covered there, at 25°C (77°F), after at least four hours at open circuit.
| Lifeline AGM state-of-charge estimate | Approximate open-circuit voltage |
|---|---|
| 100% | 12.8V or greater |
| 75% | 12.5V |
| 50% | 12.2V |
| 25% | 11.9V |
| 0% | 11.6V or less |
Lifeline labels these values approximate and notes that voltage can vary, an older battery may show a lower voltage at a given depth of discharge, and other manufacturers or battery types may differ substantially. Do not transfer the table to a flooded, gel, lithium, or different-brand AGM battery. If the exact manual publishes a different table or test condition, that manual owns the decision.
A voltage taken while charging will usually include the charge source’s influence. A voltage under load includes voltage sag from current, connections, conductors, battery resistance, temperature, and state. Either reading can be useful for system diagnosis, but neither should be looked up in the resting table as though it were OCV.
LiFePO4 needs particular restraint. Battle Born explains that two materially different charge states can show nearly the same voltage through the flat region, while load temporarily lowers voltage and rest lets it recover. Voltage becomes more informative near the ends of the curve, but the exact thresholds and protection behavior remain product-owned. Use the battery manual and a validated counting method rather than inventing precision from the second decimal place.
Once you have a defensible energy estimate, the RV battery runtime calculator can model a load with explicit usable-capacity and loss assumptions. It cannot repair an invalid SoC input.
Know when a shunt or BMS estimate is trustworthy
A shunt monitor does not look inside the cells and directly measure “37% remaining.” Victron’s SmartShunt operation manual describes a calculation that continuously integrates measured current into and out of the battery, then accounts for configured capacity, charge efficiency, discharge rate, and other behavior. The percentage is therefore an estimate with a ledger behind it.
Audit the ledger before trusting the display. The RV battery monitor shunt guide owns the topology-specific next step, including paired correct/bypass diagrams and net-current cases; this page retains ownership of the broader chemistry and measurement-method decision.
| Audit field | Passing evidence | Failure signal |
|---|---|---|
| Current path | The installed diagram and physical inspection show every intended DC load and charge source on the shunt’s system side | A charger, inverter, load return, or secondary negative connection reaches the battery side and bypasses counting |
| Battery capacity | Configured capacity matches the documented present bank arrangement and monitor instructions | A prior battery bank, nominal marketing total, or changed series/parallel arrangement remains configured |
| Chemistry and efficiency | Relevant monitor settings follow the battery and monitor documentation | Defaults are assumed to fit every lead-acid or lithium battery |
| Synchronization | The monitor reaches the documented charged-voltage, tail-current, and detection-time conditions, or is synchronized by the documented procedure | SoC shows ---, never reaches a valid full condition, or drifts farther from other evidence over successive cycles |
| Loads and charging | The displayed current changes plausibly as known loads and charge sources switch through normal operation | A known device operates while the monitor shows no corresponding change |
Victron’s installation manual states that connections on the battery side are excluded from the state-of-charge calculation and that all DC loads and charge sources should connect on the system side. This is evidence for checking an existing installation, not a generic conductor-routing procedure. If a bypass is suspected, preserve the current installation state and have the exact diagram and physical wiring reviewed safely.
Synchronization is equally important. The monitor recognizes a fully charged condition from configured charged voltage, tail current, and detection time. If the battery never meets those conditions, or the values do not match the actual battery and charger, the running total can drift. Manual synchronization can reset an estimate, but it does not restore battery capacity or prove the battery was chemically full. Resolve the reason the automatic conditions were not reached.
A documented BMS percentage can be useful, especially when the product knows its own operating limits, but read the battery manufacturer’s explanation of how that value is established. Do not assume that a phone app, control panel, and separate shunt use the same inputs or will always agree. When planning daily energy, inventory the actual consumers with the 12V load calculator instead of relying on time-to-go during a fluctuating load.
Separate state of charge from battery health
A battery can display 100% SoC and still have lost capacity. Lifeline defines state of charge relative to the battery’s current full-charge capacity, while state of health compares that current capacity with rated capacity. If an aged battery now holds materially fewer amp-hours, “full” means full for that diminished battery, not restored to its original rating.
Use disagreement as a prompt to check the method, not as permission to average incompatible numbers:
| Observation | First interpretation | Next bounded action |
|---|---|---|
| Voltage is high while a charger is active | The charge source is influencing the reading | Record it as charging voltage; use the exact resting method later if an OCV estimate is needed |
| Voltage falls when a large load starts, then recovers | The reading includes load-related sag | Record current, location, temperature, and recovery; do not convert the loaded value directly to SoC |
| Shunt percentage drifts from rested lead-acid evidence | Counting, capacity configuration, or synchronization may be wrong | Audit bypass paths and settings, then verify the documented full-charge synchronization conditions |
| Lithium voltage looks nearly unchanged over many hours | The battery may be in the flat part of its curve | Prefer a validated shunt or documented BMS estimate; do not infer that consumption stopped |
| Monitor reaches full but runtime has fallen | SoC and SoH may be getting confused | Confirm load and charging assumptions, then use a manufacturer-directed capacity evaluation if health must be established |
| Battery remains low after shore power connection | The problem may be charging-path performance rather than interpretation alone | Follow the shore-power battery charging diagnostic without opening hazardous 120V equipment |
One voltage cannot diagnose a bad battery; Trojan explicitly cautions against that shortcut. Likewise, a monitor percentage cannot prove that charging voltage, duration, temperature, or battery acceptance was correct. Preserve the evidence trail: chemistry, operating state, measurement location, current, temperature, elapsed rest, monitor configuration, and exact source table.
The practical endpoint is a bounded estimate with known assumptions. Use SoC to decide whether energy may be available. Use a load model to estimate runtime. Use a manufacturer-approved capacity procedure when the real question is health. Keeping those three tasks separate is more useful than adding another decimal place to a voltage chart.